Online help
DSO reporting »
What is the DSO report?
The DSO is a key performance indicator of receivables management. It represents the number of days of sales invoiced and not paid yet, and has a direct effect on cash flow of your business.
The report tracks the DSO of your business and splits it into current DSO (due to the payment term granted to customers) and overdue DSO (due to overdue receivable).
You can track these indicators for all the receivables of your company, by groups of customers, by customer, by analytical field (profit center, business line), ... . This allows you to quickly identify the business line or customers that need actions to be taken to improve your cash flow.
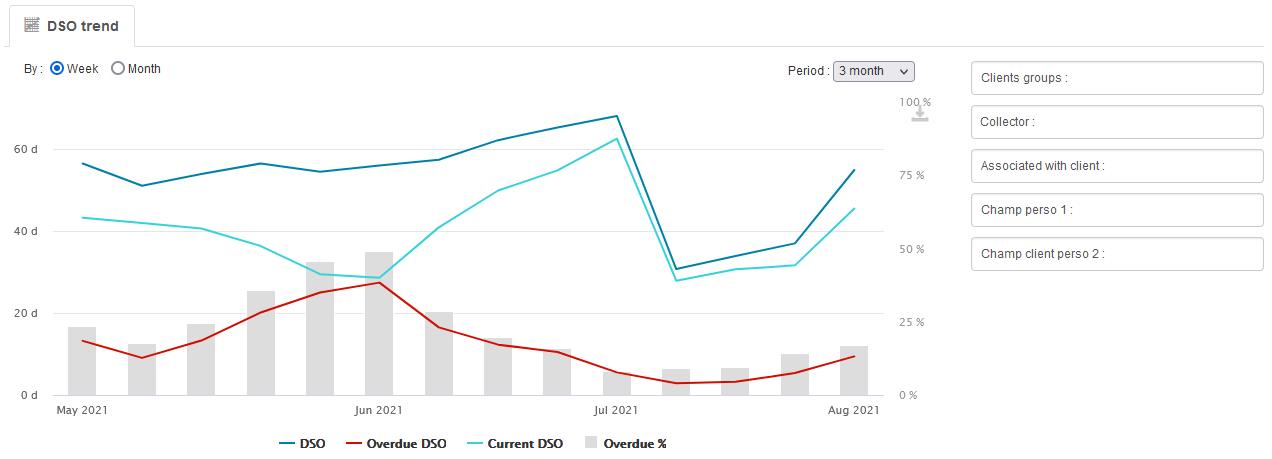
The report is presented with a graph showing the evolution of the DSO and the overdue rate:

It then details the DSO per customer by integrating the annual cost of a day of DSO per client. This cost is calculated based on the internal rate of your company defined in your preferences:

My DSO Manager may also calculate the DSO in accordance with US GAAP rules and US GAAP calendar. To activate the US GAAP DSO Contact-us
Lower is the DSO, the better it is because that means you have less cash « out » of your company.
The report tracks the DSO of your business and splits it into current DSO (due to the payment term granted to customers) and overdue DSO (due to overdue receivable).
The report also shows overdue %, another key indicator of debt collection that shows what is the percentage of overdue in total outstanding receivable.
You can track these indicators for all the receivables of your company, by groups of customers, by customer, by analytical field (profit center, business line), ... . This allows you to quickly identify the business line or customers that need actions to be taken to improve your cash flow.
The graph
The report is presented with a graph showing the evolution of the DSO and the overdue rate:

The table
It then details the DSO per customer by integrating the annual cost of a day of DSO per client. This cost is calculated based on the internal rate of your company defined in your preferences:

The DSO needs history of sales to be well calculated. Therefore it requires several weeks of data upload in My DSO Manager to be well calculated. It is also possible to upload an historic of sales.
My DSO Manager may also calculate the DSO in accordance with US GAAP rules and US GAAP calendar. To activate the US GAAP DSO Contact-us
← Back : Online help » Various questions