Online help
Report sales reporting »
What is the sales reporting?
The Sales report helps to follow the business of the company as a whole, by customer group or other segmentation or by customer.
The turnover is calculated by My DSO Manager according to the data imported. It corresponds for a given period (per week or per month) to the sum of the amounts of invoices issued during the period minus the sum of the amounts of credit notes issued over the same period.

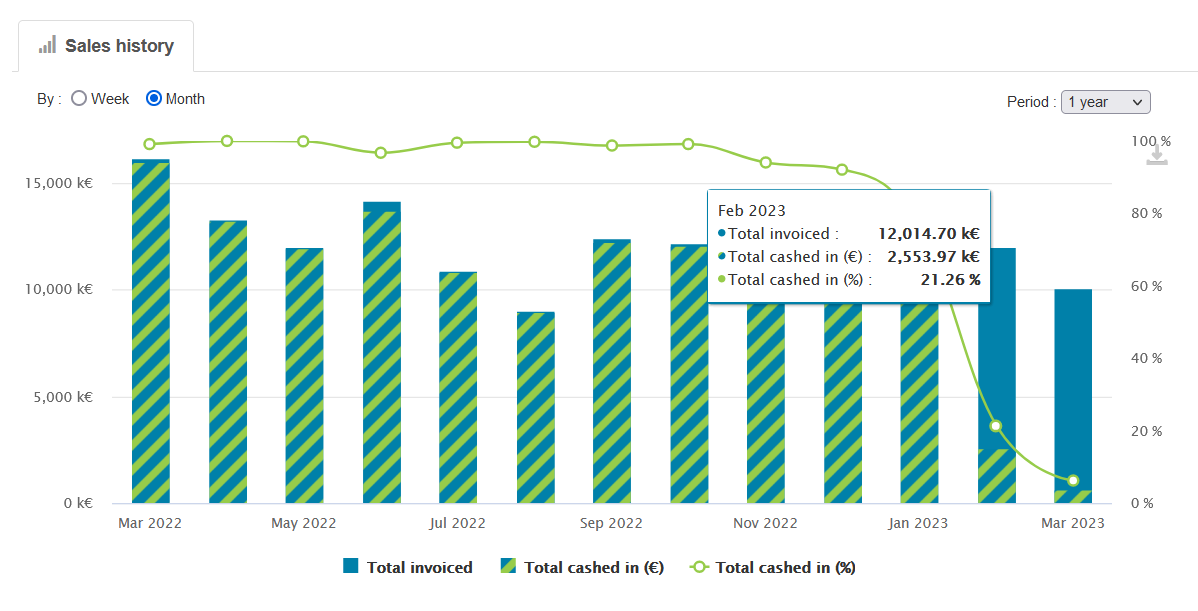
The graph is configurable to display the sales by week or month. It is also possible to select the time frame (between 1 and 12 months).
The turnover is calculated by My DSO Manager according to the data imported. It corresponds for a given period (per week or per month) to the sum of the amounts of invoices issued during the period minus the sum of the amounts of credit notes issued over the same period.
The calculation is done with the amount excluding taxes of items. However, if this field has not been uploaded, the amount including taxes will be used.
The graph
The report is presented with a graph showing the evolution of turnover and the part that has been paid:
The graph is configurable to display the sales by week or month. It is also possible to select the time frame (between 1 and 12 months).
The table
It details the sales per customer, indicating the Total sales, as well as the turnover achieved over the current year and in previous years:
This report is very useful to involve sales managers in collection as they can easily see the part of « their » turnover that is not paid yet.
← Back : Online help » Various questions