Online help
Disputes report »
What is the Disputes report?
The disputes report alows to visualize both the volume of disputes in number and amount by type (administrative, quality, price, etc.), the average time of dispute resolution, their breakdown by customer or customer group, as well as the person in charge of the dispute resolution.
So it is an operational tool to identify the main causes of disputes and undertake action plans to solve them quickly.
You can customize this report by collector, resolver (sales manager, customer care person, etc.) or custom field, which allows to easily browse disputes associated with them. You can also select a date to display the dispute situation on an earlier date.
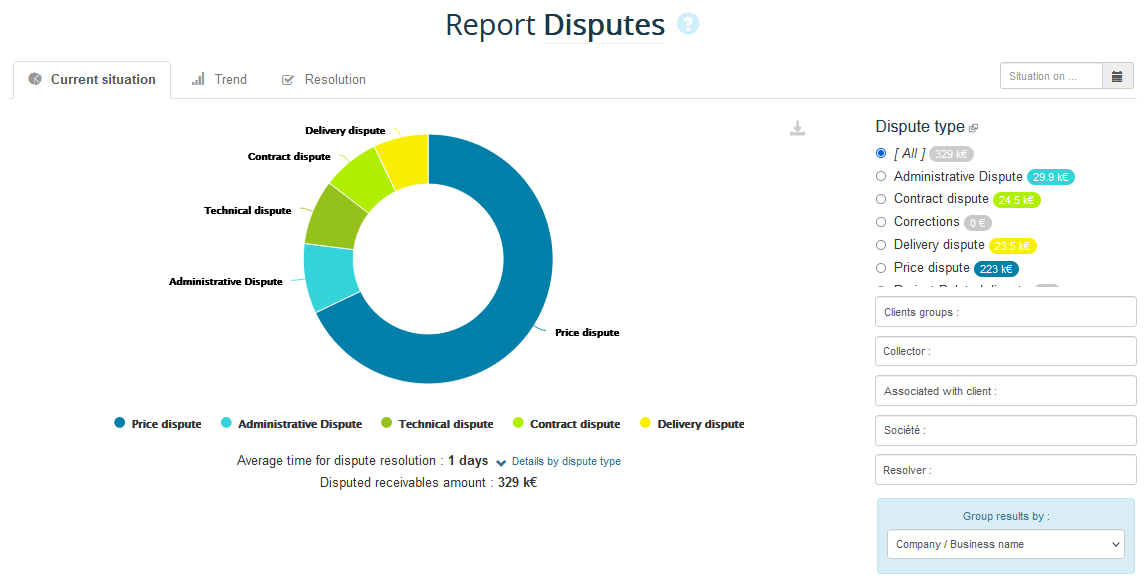
it presents the breakdown in amount by type of dispute, and the average time of dispute resolution:

It's also possible to visualize the evolution of disputes.
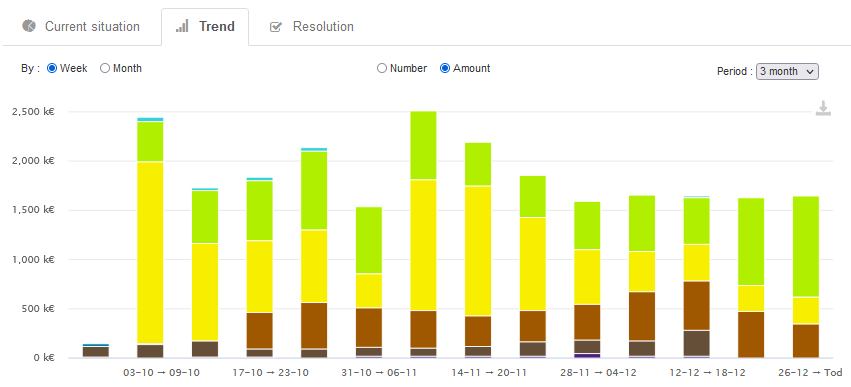
This approach is particularly interesting for observing improvements and / or deteriorations in performance on multiple axes and for highlighting recurring disputes and their evolution:

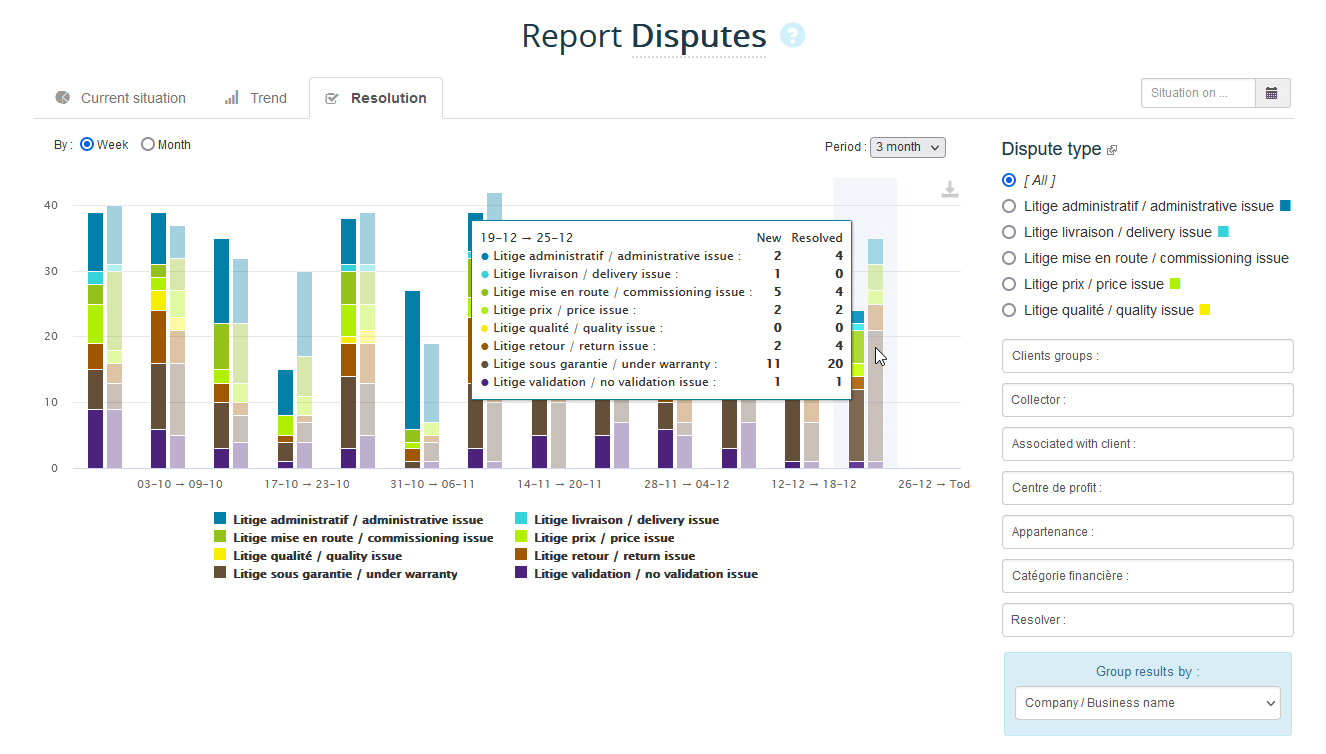
This tab highlights by period (week or month) the number and type of new disputes versus those that have been resolved, which allows you in particular:

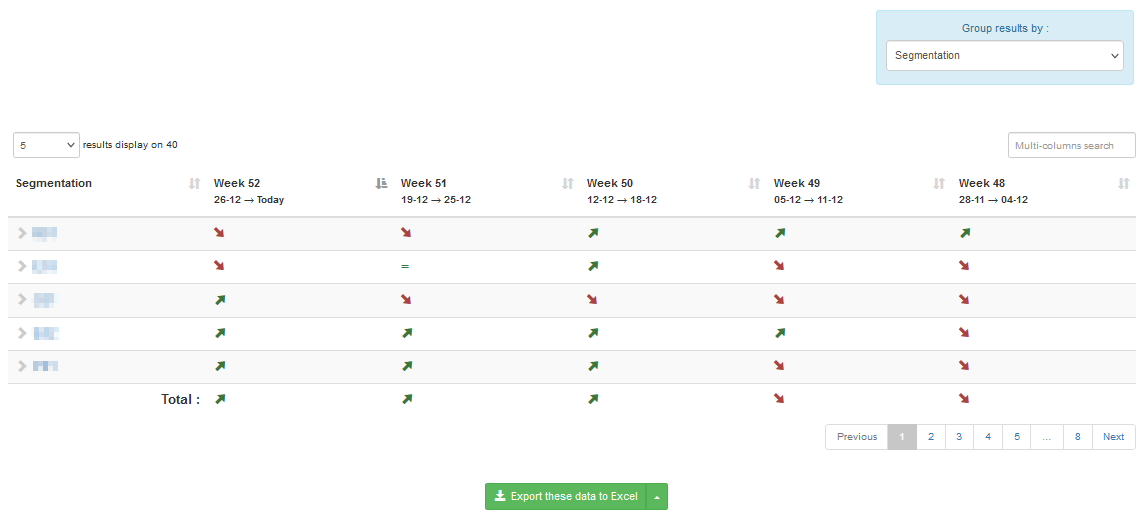
The table below the graph allows you to refine the analysis by viewing by customer, portfolio or customer segmentation the trend concerning the number of disputes in progress, taking into account new ones and those resolved over the period.

Like other reports you can select a date to display the dispute situation at an earlier date, as well as click on the legend to hide / display the elements
By default this list highlights the amounts in dispute and the number of items per customer. It can be sorted and filtered in many ways to target clients on which you want to act:

It is possible to « Group results » by collector and by any customer analytical field:

So it is an operational tool to identify the main causes of disputes and undertake action plans to solve them quickly.
You can customize this report by collector, resolver (sales manager, customer care person, etc.) or custom field, which allows to easily browse disputes associated with them. You can also select a date to display the dispute situation on an earlier date.
The graph
Current situation
it presents the breakdown in amount by type of dispute, and the average time of dispute resolution:

Trend
It's also possible to visualize the evolution of disputes.
This approach is particularly interesting for observing improvements and / or deteriorations in performance on multiple axes and for highlighting recurring disputes and their evolution:

Resolution
This tab highlights by period (week or month) the number and type of new disputes versus those that have been resolved, which allows you in particular:
- To identify the typology of new disputes, with the aim of dealing with the root of the problem. For example, correcting a recurring quality problem that systematically generates customer dissatisfaction and unpaid invoices.
- To visually ensure that the momentum is good, i.e. more disputes are resolved rather than created.

The table below the graph allows you to refine the analysis by viewing by customer, portfolio or customer segmentation the trend concerning the number of disputes in progress, taking into account new ones and those resolved over the period.

Like other reports you can select a date to display the dispute situation at an earlier date, as well as click on the legend to hide / display the elements
The table
By default this list highlights the amounts in dispute and the number of items per customer. It can be sorted and filtered in many ways to target clients on which you want to act:

It is possible to « Group results » by collector and by any customer analytical field:

The dispute rate allows to identify customers with the highest proportion of disputes. This helps to understand the causes of this situation and take the appropriate measures to improve it.
← Back : Online help » Various questions